&l;img class=&q; wp-image-7544 size-full&q; src=&q;http://blogs-images.forbes.com/baldwin/files/2018/07/Forbes-Best-ETFs.jpg?width=960&q; alt=&q;&q; data-height=&q;788&q; data-width=&q;940&q;&g;
Funds holding foreign securities haven&s;t done terribly well in recent years, but if you want to bet on a reversal of fortune, the exchange-traded funds in this table are the cheap way to do it. You can hold a $10,000 position in any of them for three months at a cost of $10 or less. The best operators get your cost down to $2.
Costs reflect bid/ask spreads, expense ratios charged by the fund vendor and any offsets to those expenses from securities lending revenue.
&l;div class=&q;table-wrapper&q;&g;&l;table width=&q;531&q;&g;&l;tbody&g;&l;tr&g;&l;td width=&q;64&q;&g;&l;/td&g; &l;td width=&q;331&q;&g;&l;/td&g; &l;td rowspan=&q;3&q; width=&q;72&q;&g;3-month Holding Cost*&l;/td&g; &l;td width=&q;64&q;&g;&l;/td&g; &l;/tr&g;&l;tr&g;&l;td&g;&l;/td&g; &l;td&g;&l;/td&g; &l;td rowspan=&q;2&q; width=&q;64&q;&g;Liquidity Score&l;/td&g; &l;/tr&g;&l;tr&g;&l;td&g;Ticker&l;/td&g; &l;td&g;Exchange-traded fund&l;/td&g; &l;/tr&g;&l;tr&g;&l;td&g;&l;/td&g; &l;td&g;&l;/td&g; &l;td&g;&l;/td&g; &l;td&g;&l;/td&g; &l;/tr&g;&l;tr&g;&l;td&g;&l;/td&g; &l;td&g;&l;em&g;Diversified&l;/em&g;&l;/td&g; &l;td&g;&l;/td&g; &l;td&g;&l;/td&g; &l;/tr&g;&l;tr&g;&l;td&g;VEA&l;/td&g; &l;td&g;Vanguard FTSE Developed Markets&l;/td&g; &l;td&g;$2.05&l;/td&g; &l;td&g;A&l;/td&g; &l;/tr&g;&l;tr&g;&l;td&g;IEFA&l;/td&g; &l;td&g;iShares Core MSCI EAFE&l;/td&g; &l;td&g;2.46&l;/td&g; &l;td&g;A+&l;/td&g; &l;/tr&g;&l;tr&g;&l;td&g;VSS&l;/td&g; &l;td&g;Vanguard FTSE All-Wld ex-US SmCp&l;/td&g; &l;td&g;2.51&l;/td&g; &l;td&g;B&l;/td&g; &l;/tr&g;&l;tr&g;&l;td&g;VEU&l;/td&g; &l;td&g;Vanguard FTSE All-Wld ex-US&l;/td&g; &l;td&g;3.40&l;/td&g; &l;td&g;A&l;/td&g; &l;/tr&g;&l;tr&g;&l;td&g;SPDW&l;/td&g; &l;td&g;SPDR Portfolio World ex-US&l;/td&g; &l;td&g;3.68&l;/td&g; &l;td&g;A&l;/td&g; &l;/tr&g;&l;tr&g;&l;td&g;SCHF&l;/td&g; &l;td&g;Schwab International Equity&l;/td&g; &l;td&g;3.96&l;/td&g; &l;td&g;A&l;/td&g; &l;/tr&g;&l;tr&g;&l;td&g;VT&l;/td&g; &l;td&g;Vanguard Total World Stock&l;/td&g; &l;td&g;4.04&l;/td&g; &l;td&g;A&l;/td&g; &l;/tr&g;&l;tr&g;&l;td&g;IXUS&l;/td&g; &l;td&g;iShares Core MSCI Total Intl Stk&l;/td&g; &l;td&g;4.60&l;/td&g; &l;td&g;A&l;/td&g; &l;/tr&g;&l;tr&g;&l;td&g;VXUS&l;/td&g; &l;td&g;Vanguard Total International Stock&l;/td&g; &l;td&g;5.40&l;/td&g; &l;td&g;A&l;/td&g; &l;/tr&g;&l;tr&g;&l;td&g;SCZ&l;/td&g; &l;td&g;iShares MSCI EAFE Small-Cap&l;/td&g; &l;td&g;5.85&l;/td&g; &l;td&g;A&l;/td&g; &l;/tr&g;&l;tr&g;&l;td&g;EFAV&l;/td&g; &l;td&g;iShares Edge MSCI Min Vol EAFE&l;/td&g; &l;td&g;7.62&l;/td&g; &l;td&g;A&l;/td&g; &l;/tr&g;&l;tr&g;&l;td&g;ACWI&l;/td&g; &l;td&g;iShares MSCI ACWI&l;/td&g; &l;td&g;8.94&l;/td&g; &l;td&g;A+&l;/td&g; &l;/tr&g;&l;tr&g;&l;td&g;SCHC&l;/td&g; &l;td&g;Schwab International Small-Cap Eq&l;/td&g; &l;td&g;8.95&l;/td&g; &l;td&g;B&l;/td&g; &l;/tr&g;&l;tr&g;&l;td&g;IDEV&l;/td&g; &l;td&g;iShares Core MSCI Intl Dev Mkts&l;/td&g; &l;td&g;8.96&l;/td&g; &l;td&g;B&l;/td&g; &l;/tr&g;&l;tr&g;&l;td&g;EFA&l;/td&g; &l;td&g;iShares MSCI EAFE&l;/td&g; &l;td&g;9.17&l;/td&g; &l;td&g;A+&l;/td&g; &l;/tr&g;&l;tr&g;&l;td&g;&l;/td&g; &l;td&g;&l;/td&g; &l;td&g;&l;/td&g; &l;td&g;&l;/td&g; &l;/tr&g;&l;tr&g;&l;td&g;&l;/td&g; &l;td&g;&l;/td&g; &l;td&g;&l;/td&g; &l;td&g;&l;/td&g; &l;/tr&g;&l;tr&g;&l;td&g;&l;/td&g; &l;td&g;&l;em&g;Regional&l;/em&g;&l;/td&g; &l;td&g;&l;/td&g; &l;td&g;&l;/td&g; &l;/tr&g;&l;tr&g;&l;td&g;VGK&l;/td&g; &l;td&g;Vanguard FTSE Europe&l;/td&g; &l;td&g;2.00&l;/td&g; &l;td&g;A+&l;/td&g; &l;/tr&g;&l;tr&g;&l;td&g;VPL&l;/td&g; &l;td&g;Vanguard FTSE Pacific&l;/td&g; &l;td&g;3.89&l;/td&g; &l;td&g;A&l;/td&g; &l;/tr&g;&l;tr&g;&l;td&g;IEUR&l;/td&g; &l;td&g;iShares Core MSCI Europe&l;/td&g; &l;td&g;5.16&l;/td&g; &l;td&g;A&l;/td&g; &l;/tr&g;&l;tr&g;&l;td&g;FEZ&l;/td&g; &l;td&g;SPDR EURO Stoxx 50&l;/td&g; &l;td&g;8.48&l;/td&g; &l;td&g;A&l;/td&g; &l;/tr&g;&l;tr&g;&l;td&g;&l;/td&g; &l;td&g;&l;/td&g; &l;td&g;&l;/td&g; &l;td&g;&l;/td&g; &l;/tr&g;&l;tr&g;&l;td&g;&l;/td&g; &l;td&g;&l;/td&g; &l;td&g;&l;/td&g; &l;td&g;&l;/td&g; &l;/tr&g;&l;tr&g;&l;td&g;&l;/td&g; &l;td&g;&l;em&g;Emerging&l;/em&g;&l;/td&g; &l;td&g;&l;/td&g; &l;td&g;&l;/td&g; &l;/tr&g;&l;tr&g;&l;td&g;IEMG&l;/td&g; &l;td&g;iShares Core MSCI Emerging Markets&l;/td&g; &l;td&g;1.92&l;/td&g; &l;td&g;A+&l;/td&g; &l;/tr&g;&l;tr&g;&l;td&g;VWO&l;/td&g; &l;td&g;Vanguard FTSE Emerging Markets&l;/td&g; &l;td&g;4.62&l;/td&g; &l;td&g;A&l;/td&g; &l;/tr&g;&l;tr&g;&l;td&g;SCHE&l;/td&g; &l;td&g;Schwab Emerging Markets Equity&l;/td&g; &l;td&g;6.76&l;/td&g; &l;td&g;A&l;/td&g; &l;/tr&g;&l;tr&g;&l;td&g;SPEM&l;/td&g; &l;td&g;SPDR Portfolio Emerging Markets&l;/td&g; &l;td&g;9.20&l;/td&g; &l;td&g;B&l;/td&g; &l;/tr&g;&l;tr&g;&l;td&g;&l;/td&g; &l;td&g;&l;/td&g; &l;td&g;&l;/td&g; &l;td&g;&l;/td&g; &l;/tr&g;&l;tr&g;&l;td&g;&l;/td&g; &l;td&g;&l;/td&g; &l;td&g;&l;/td&g; &l;td&g;&l;/td&g; &l;/tr&g;&l;tr&g;&l;td&g;&l;/td&g; &l;td&g;&l;em&g;Other&l;/em&g;&l;/td&g; &l;td&g;&l;/td&g; &l;td&g;&l;/td&g; &l;/tr&g;&l;tr&g;&l;td&g;BNDX&l;/td&g; &l;td&g;Vanguard Total International Bond&l;/td&g; &l;td&g;4.64&l;/td&g; &l;td&g;A&l;/td&g; &l;/tr&g;&l;tr&g;&l;td&g;VNQI&l;/td&g; &l;td&g;Vanguard Global ex-US Real Est&l;/td&g; &l;td&g;5.95&l;/td&g; &l;td&g;A&l;/td&g; &l;/tr&g;&l;tr&g;&l;td&g;THD&l;/td&g; &l;td&g;iShares MSCI Thailand Capped&l;/td&g; &l;td&g;8.81&l;/td&g; &l;td&g;A&l;/td&g; &l;/tr&g;&l;/tbody&g;&l;/table&g;&l;/div&g;
*&l;em&g;Cost of a $10,000 position held for three months. Reflects bid/ask spread, expense ratio and cost offset from securities lending.&l;/em&g;
&l;em&g;Data sources: Morningstar, Bloomberg, fund distributors&l;/em&g;
Over longer holding periods, different ETFs rise to the top in cost efficiency. To see rankings for ten-year investments, see &l;a href=&q;https://www.forbes.com/sites/baldwin/2018/06/20/best-etfs-for-investors-2018/&q;&g;&l;strong&g;Best ETFs for Investors 2018&l;/strong&g;&l;/a&g;.
For links to the three-month scores in different categories, see &l;a href=&q;https://www.forbes.com/sites/baldwin/2018/08/02/best-etfs-for-trading/&q;&g;&l;strong&g;Best ETFs for Trading&l;/strong&g;&l;/a&g;.
 ADAMCAPITAL Gestao de Recursos Ltda. lowered its holdings in Biogen Inc (NASDAQ:BIIB) by 30.5% in the 2nd quarter, HoldingsChannel reports. The fund owned 125,856 shares of the biotechnology company’s stock after selling 55,267 shares during the quarter. Biogen comprises approximately 1.8% of ADAMCAPITAL Gestao de Recursos Ltda.’s portfolio, making the stock its 16th largest holding. ADAMCAPITAL Gestao de Recursos Ltda.’s holdings in Biogen were worth $36,528,000 at the end of the most recent quarter.
  Northstar Investment Advisors LLC trimmed its position in iShares Core 1-5 Year USD Bond ETF (NASDAQ:ISTB) by 20.0% during the second quarter, according to its most recent disclosure with the Securities and Exchange Commission (SEC). The fund owned 59,671 shares of the company’s stock after selling 14,909 shares during the quarter. Northstar Investment Advisors LLC owned 0.14% of iShares Core 1-5 Year USD Bond ETF worth $5,607,000 at the end of the most recent reporting period.
  Bytecoin (CURRENCY:BCN) traded down 6.2% against the US dollar during the 24 hour period ending at 13:00 PM Eastern on July 9th. Bytecoin has a total market capitalization of $550.44 million and $7.57 million worth of Bytecoin was traded on exchanges in the last day. One Bytecoin coin can currently be bought for approximately $0.0030 or 0.00000045 BTC on major cryptocurrency exchanges including Stocks.Exchange, Binance, Poloniex and cfinex. In the last seven days, Bytecoin has traded 14.3% lower against the US dollar.
  Media stories about Permian Basin Royalty Trust (NYSE:PBT) have been trending somewhat positive this week, Accern reports. The research group identifies positive and negative news coverage by reviewing more than 20 million blog and news sources in real time. Accern ranks coverage of companies on a scale of -1 to 1, with scores nearest to one being the most favorable. Permian Basin Royalty Trust earned a daily sentiment score of 0.17 on Accern’s scale. Accern also assigned media coverage about the oil and gas producer an impact score of 46.225040116545 out of 100, meaning that recent news coverage is somewhat unlikely to have an impact on the stock’s share price in the immediate future.
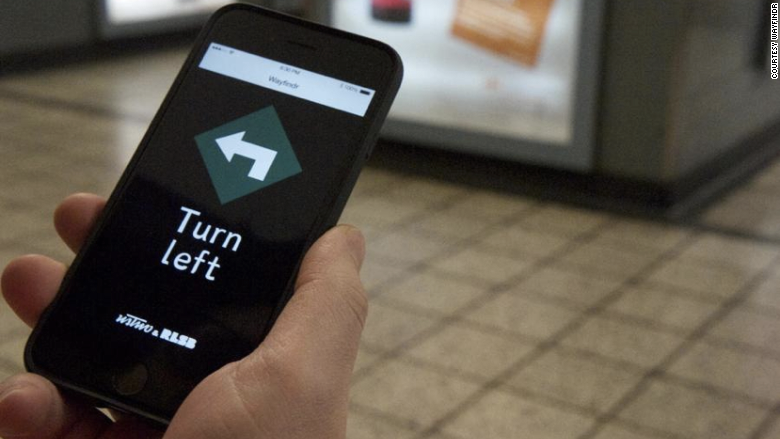 Wayfindr's app provides indoor navigation.
  OrCam's MyEye 2.0.